Troubleshooting Query timeouts in SQL Server
Hello all,
While working with SQL Server, one of the common issue application teams encounter is timeouts. In this article, we are covering approach to troubleshoot SQL Command/Query timeouts, data collection and data analysis steps to isolate further.
There are 2 types of timeouts.
- Command Timeout
- Connection Timeout.
For more information on connection timeout issues, refer here:
Simulating Command timeout:
For demonstration purpose, I am using a sample web application which connections to the SQL database Adventureworks2014. The application connects to the database to retrieve customers/Products details.
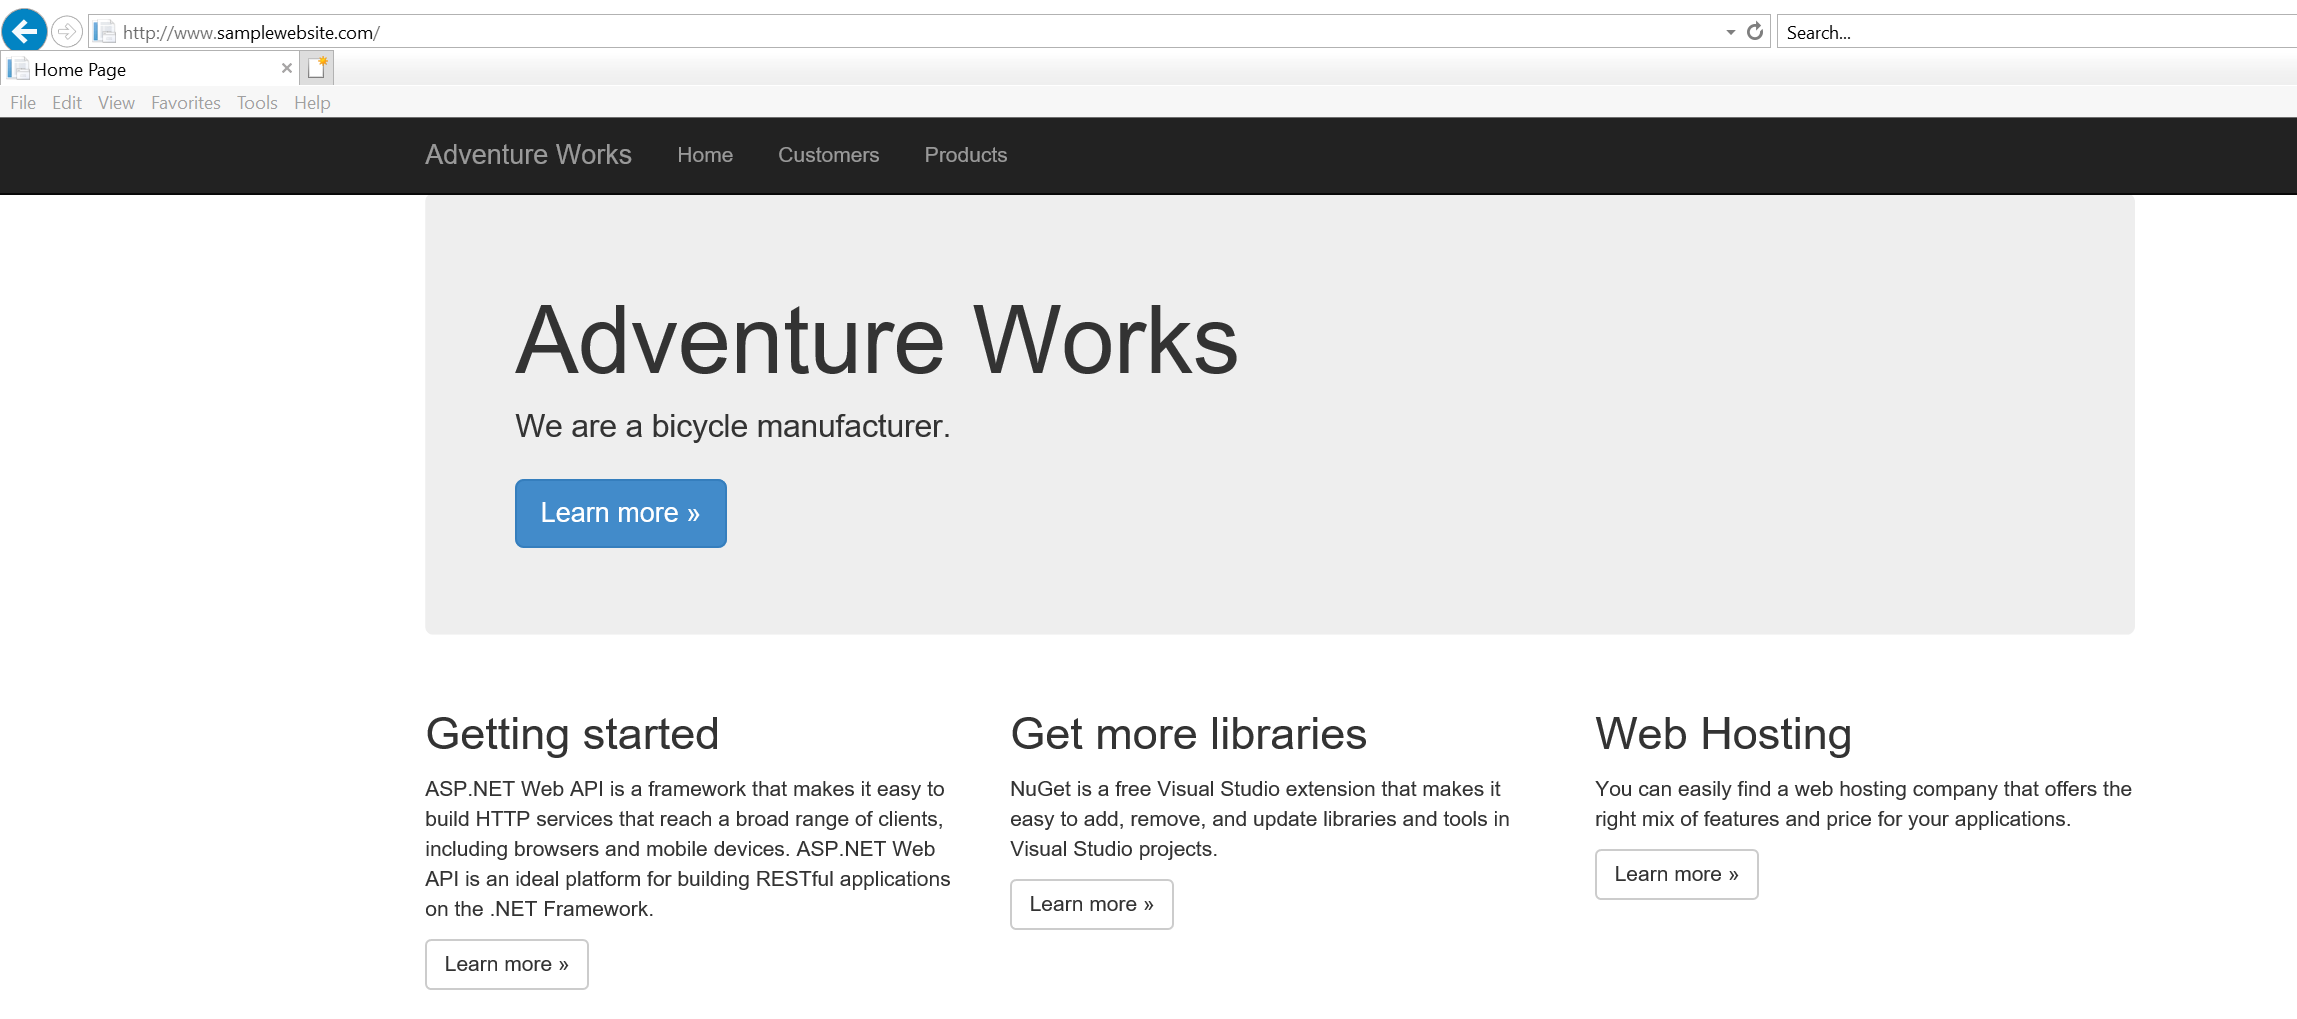
To simulate the timeout error, click on Customers menu:
From the exception stack trace, its evident that application is trying to retrieve some data and System.Data.SqlClient.SqlCommand.ExecuteReader method is called, but since the ExecuteReader method execution has not completed in the Command Timeout value (30 seconds), the application is reporting Command Timeout.
Exception Details: System.ComponentModel.Win32Exception: The wait operation timed out
Stack Trace:
 [Win32Exception (0x80004005): The wait operation timed out]
[SqlException (0x80131904): Execution Timeout Expired.  The timeout period elapsed prior to completion of the operation or the server is not responding.]
System.Data.SqlClient.SqlConnection.OnError(SqlException exception, Boolean breakConnection, Action`1 wrapCloseInAction) +3305692
System.Data.SqlClient.TdsParser.ThrowExceptionAndWarning(TdsParserStateObject stateObj, Boolean callerHasConnectionLock, Boolean asyncClose) +736
System.Data.SqlClient.TdsParser.TryRun(RunBehavior runBehavior, SqlCommand cmdHandler, SqlDataReader dataStream, BulkCopySimpleResultSet bulkCopyHandler, TdsParserStateObject stateObj, Boolean& dataReady) +4061
System.Data.SqlClient.SqlDataReader.TryConsumeMetaData() +90
System.Data.SqlClient.SqlDataReader.get_MetaData() +99
System.Data.SqlClient.SqlCommand.FinishExecuteReader(SqlDataReader ds, RunBehavior runBehavior, String resetOptionsString, Boolean isInternal, Boolean forDescribeParameterEncryption, Boolean shouldCacheForAlwaysEncrypted) +604
System.Data.SqlClient.SqlCommand.RunExecuteReaderTds(CommandBehavior cmdBehavior, RunBehavior runBehavior, Boolean returnStream, Boolean async, Int32 timeout, Task& task, Boolean asyncWrite, Boolean inRetry, SqlDataReader ds, Boolean describeParameterEncryptionRequest) +3303
System.Data.SqlClient.SqlCommand.RunExecuteReader(CommandBehavior cmdBehavior, RunBehavior runBehavior, Boolean returnStream, String method, TaskCompletionSource`1 completion, Int32 timeout, Task& task, Boolean& usedCache, Boolean asyncWrite, Boolean inRetry) +667
System.Data.SqlClient.SqlCommand.RunExecuteReader(CommandBehavior cmdBehavior, RunBehavior runBehavior, Boolean returnStream, String method) +83
System.Data.SqlClient.SqlCommand.ExecuteReader(CommandBehavior behavior, String method) +301
System.Data.Entity.Infrastructure.Interception.InternalDispatcher`1.Dispatch(TTarget target, Func`3 operation, TInterceptionContext interceptionContext, Action`3 executing, Action`3 executed) +104
System.Data.Entity.Infrastructure.Interception.DbCommandDispatcher.Reader(DbCommand command, DbCommandInterceptionContext interceptionContext) +499
System.Data.Entity.Core.EntityClient.Internal.EntityCommandDefinition.ExecuteStoreCommands(EntityCommand entityCommand, CommandBehavior behavior) +36
Identifying SQL Queries which are Timing Out:
Next step is to identify the SQL queries timing out. Easier approach would be check with the application team on the queries executed. Using SQL tools like Extended Events and SQL Profiler, we can also identify the queries timing outs using Attention event.
If you are using SQL Extended Events, collect the events like SQL_Batch_Starting, SQL_batch_completed along with attention event to identify the queries timing out.

DATA COLLECTION FOR QUERY TIMEOUTS:
Another easier approach to collect the data would be to use PSSDIAG Configuration manager to collect the relavant data like Performance Statistics dmv data, Profiler/Extended event data, blocking data, etc.
PSSDIAG data collection utility can be downloaded from: https://github.com/Microsoft/DiagManager
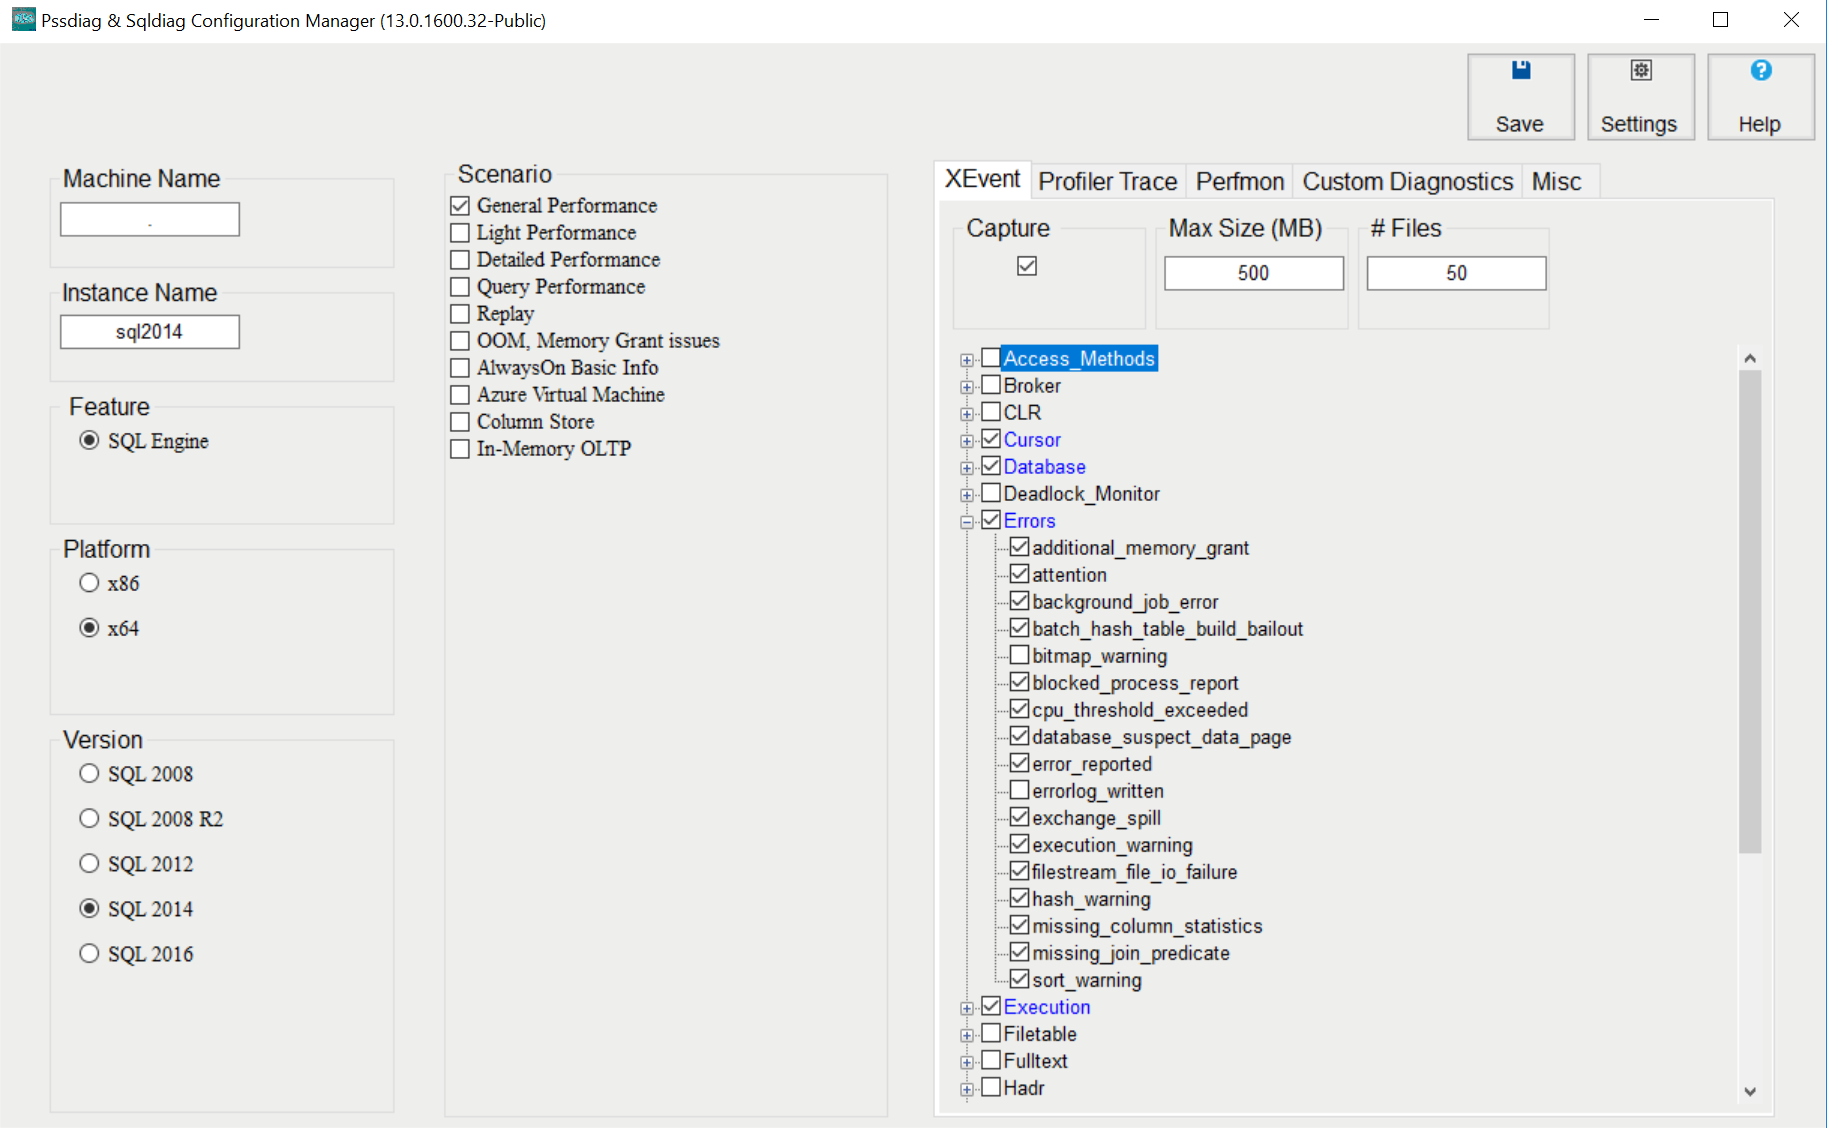
Once you launch PSSDIAG configuration utility, fill in the necessary details like: Instance name, SQL Build, Scenario and Profiler/Xevent.
While capturing the data to track query timeouts, ensure that Attention events are selected in Errors section.
Once the events are selected, save the pssd.zip file and extract the contents of the zip file.
To initiate the data collection, navigate to the pssdiag location using command prompt(Run as Administrator) and launch pssdiag.cmd
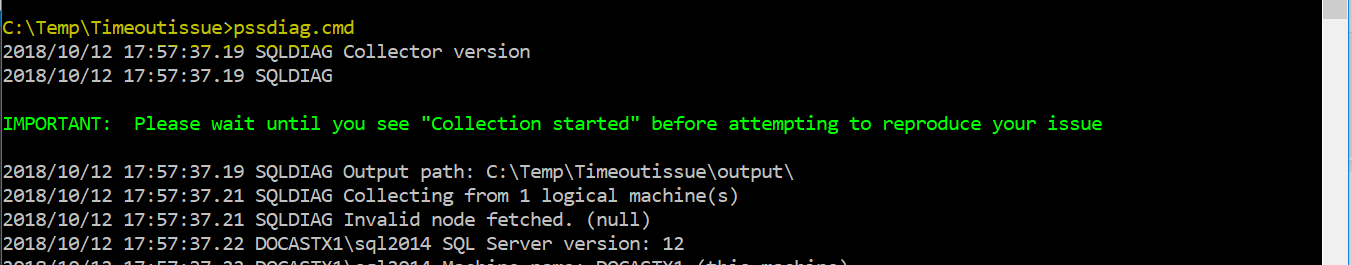
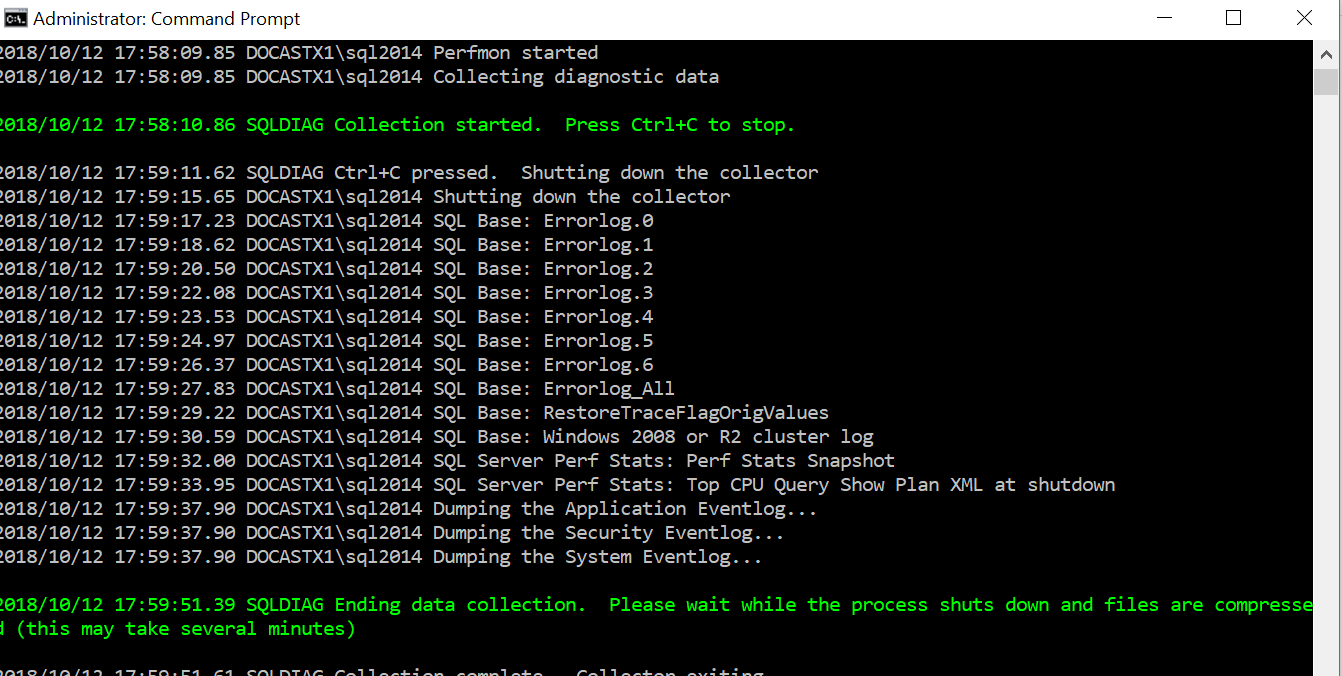
Once "SQLDIAG collection started" message appears, reproduce the timeout issue. Once the issue is reproduced, stop the data collection using CTRL + C.
DATA ANALYSIS:
To analyze the PSSDIAG data collected, you can use SQLNexus tool which can be downloaded from: https://github.com/Microsoft/SqlNexus
Installation of SQL nexus tool details are at: https://github.com/Microsoft/SqlNexus/wiki/Installation
Once the installation is complete, launch the tool to import the PSSDIAG data collected earlier.
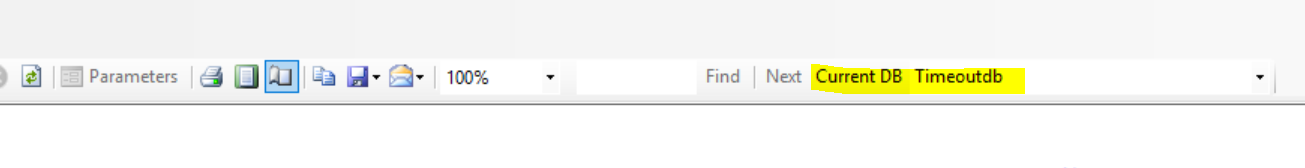
Select the database to host the Nexus data.
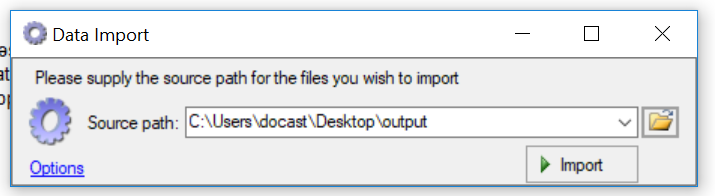
Click on Import and point to the PSSDIAG output folder:
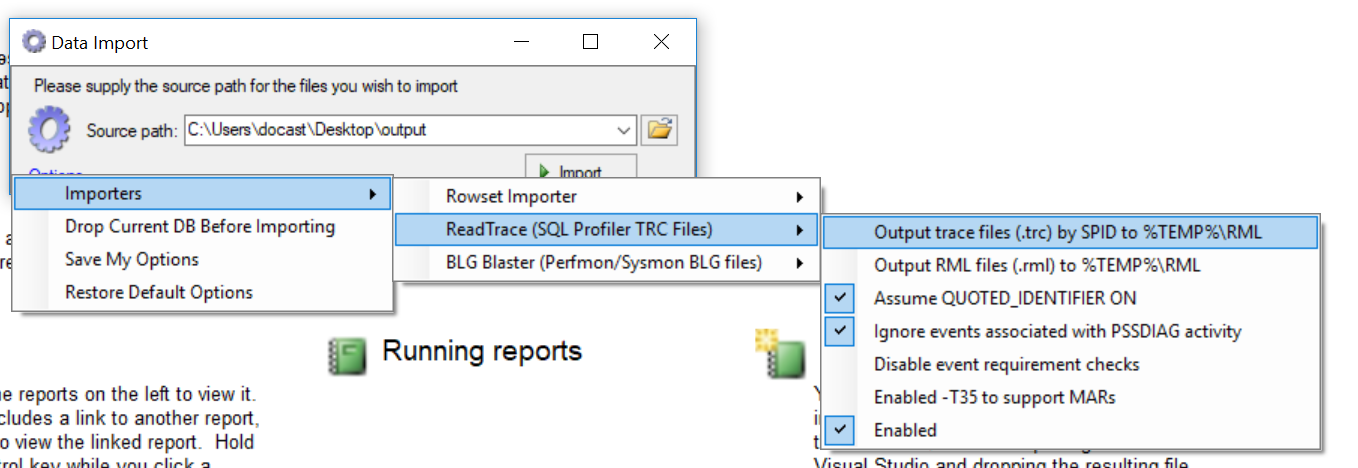
An interesting feature of SQL nexus is that it can import the SQL Profiler trace data collected and output the trace files by SPID, which will help when you are interested in tracing the Profiler data at SPID level.
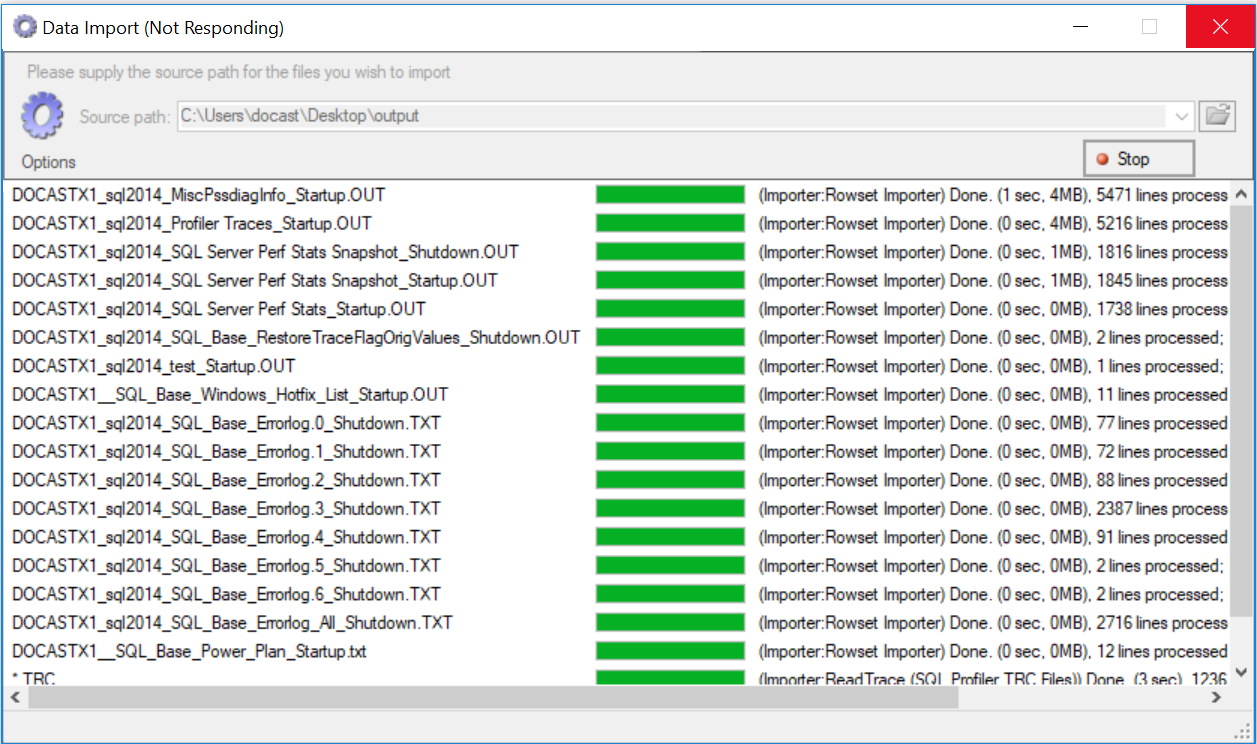
Once the data import is successful:
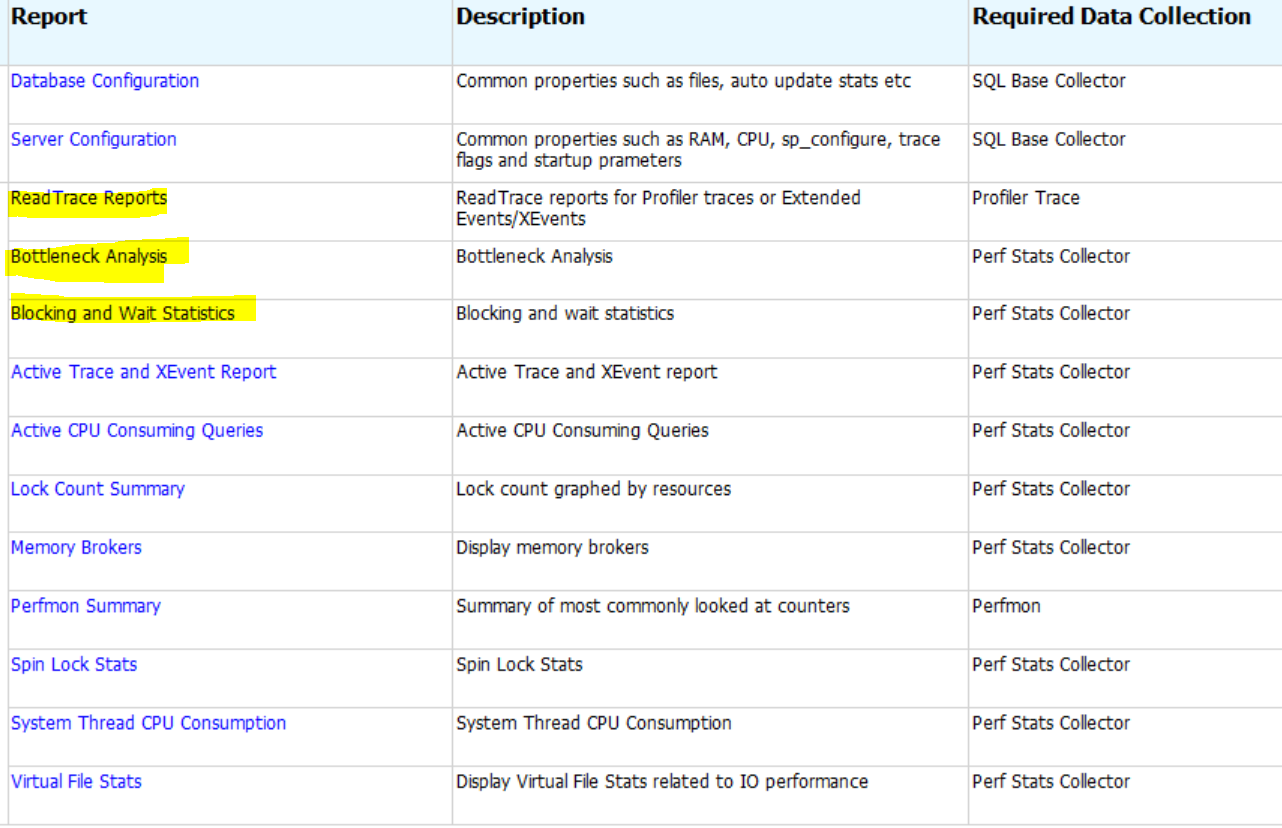
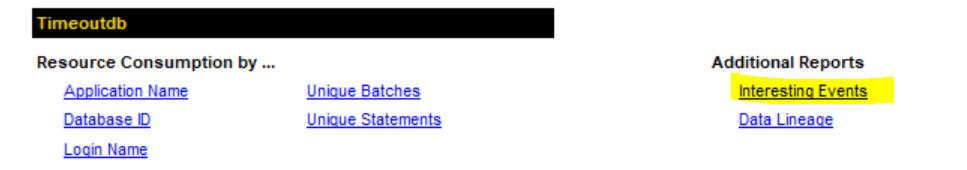
Click on Read Trace reports which is a starting point to review all batch/Statement level queries. To review the timeouts:
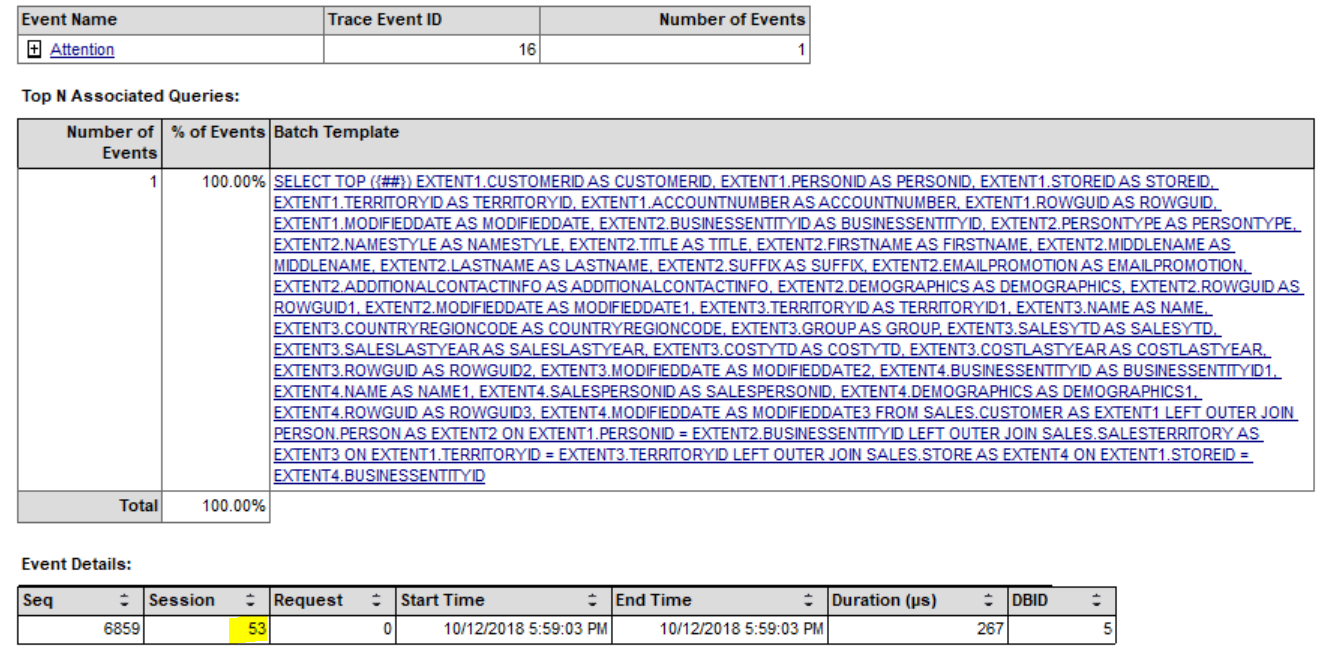
From the above screenshot, its evident that the query executed by session ID 53 has timed out.
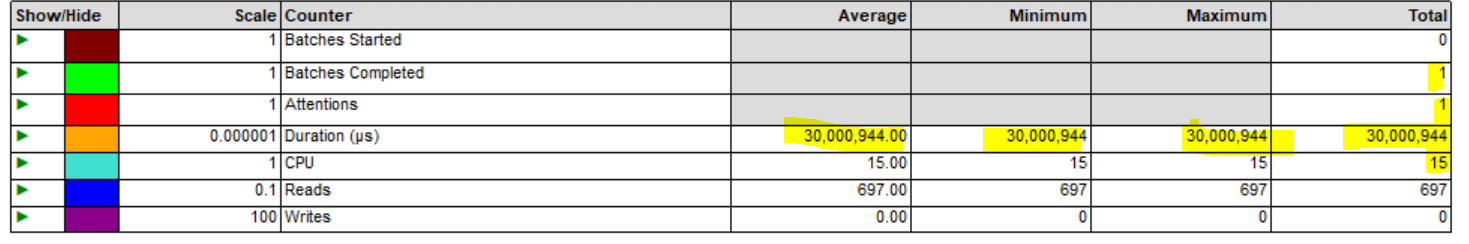
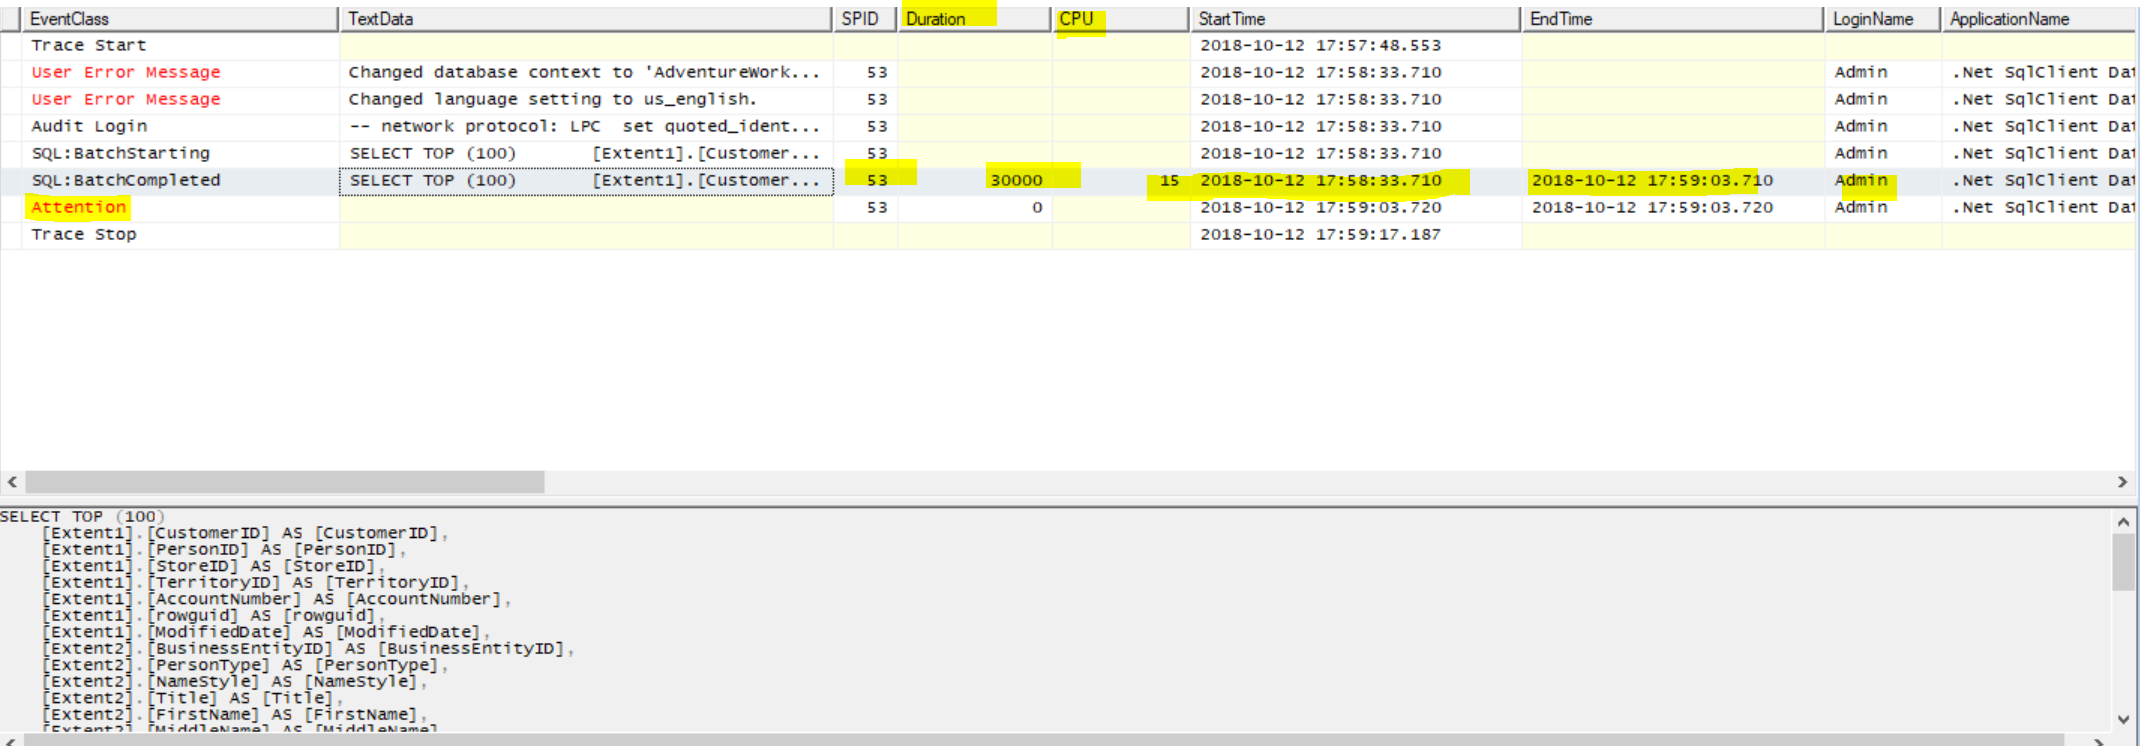
Launching the SQL profiler trace captured, verify that SPID 53 has timed out after 30 seconds as highlighted below. Review the CPU time as well, in our scenario, CPU time is in milli seconds, which explains that the query is not a CPU bound query. Hence you need to identify the waits associated with session ID 53.
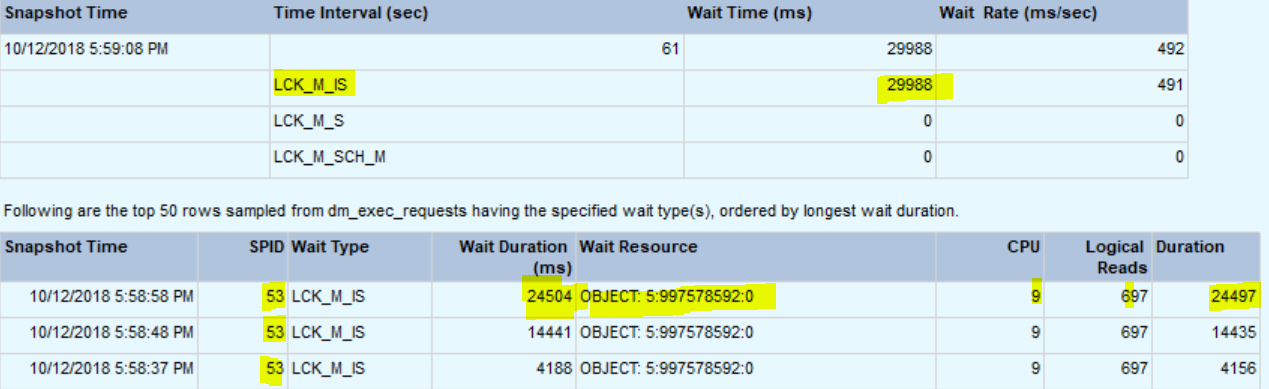
Reviewing the Blocking details, we can see that session ID 53 is waiting throughout on OBJECT:5:997578592:0 wait resource with wait type: LCK_M_IS. Since its execution didn’t complete in 30 seconds, it has timed out and application raises ABORT with SQL Server.
Next step would be to identify the headblocker query and identify the blocking query and check if it’s a RUNNER/Waiter query.
SUMMARY:
We can use PSSDIAG and SQL Nexus tools to identify the queries timing out and root cause of timeout issue. Capture the SQL profiler trace/Xevent with Attention event which will help in narrowing down the SPID’s timing out. Also, not that the PSSDIAG and SQL nexus tool can be used to collect data for Slow query performance, General bottleneck analysis and reviews waits and address other SQL performance issues as well.
Hope this blog helps in isolating query timeout issues.
Please share your feedback, questions and/or suggestions.
Thanks,
Don Castelino | Premier Field Engineer | Microsoft
Disclaimer: All posts are provided AS IS with no warranties and confer no rights. Additionally, views expressed here are my own and not those of my employer, Microsoft.